TECH CONTRIBUTION SERIES ① — SMART FACTORY → DARK FACTORY
From a Connected Factory to One That Makes Its Own Decisions
3-Second Summary
- A foundation of connectivity and visibility / It connected equipment, sensors, and production systems in real time and made shop-floor conditions visible.
- Human judgment remains the bottleneck / Root-cause analysis, future quality prediction, and process-parameter changes still depend on experienced operators.
- The next advantage is converting insight into action / Data must be connected to prediction, decision, and execution to reduce response time and judgment variability.
Why Was the Smart Factory Needed?
Manufacturing is inherently variable. Even when the same equipment and work standards are used, changes in raw- material properties, ambient temperature, equipment wear, work sequence, and production speed can destabilize both quality and productivity. In the past, these variations were managed through operator experience and post- process inspection. As product variety increases and delivery windows shrink, however, it becomes difficult to keep the entire process stable through human observation alone.
The Smart Factory emerged to manage this complexity with data. By connecting information generated by PLCs, sensors, cameras, MES, SCADA, and quality systems, manufacturers can monitor output and defect rates quickly and trace problems back to the time and conditions in which they occurred. NIST describes Smart Manufacturing as a system that transforms data collected across manufacturing processes into knowledge that can support decision- making.1
The key term in this definition is not simply “data collection,” but “decision-making.” The Smart Factory established the foundation for collecting data, yet in many facilities the final link from data to decision and execution is still not sufficiently automated. This is the distinction between the Smart Factory and the next stage of autonomous manufacturing.
Three Foundations Created by the Smart Factory
- Connectivity / Information from equipment, sensors, and production systems can be viewed in one place, and data across processes can be linked by time and product.
- Visibility / KPIs such as output, quality, equipment condition, and energy consumption can be monitored in real time or at short intervals.
- Traceability and standardization / Work history and the basis for decisions remain as data, creating a foundation for process comparison, defect root-cause tracing, and verification of improvement effects.
The Measurable Results of Connectivity and Visibility
The value of a Smart Factory does not come merely from building dashboards; it appears when data is integrated into the way the plant is operated. New Global Lighthouse sites announced by the World Economic Forum in 2025 deployed digital technologies such as AI, machine learning, and advanced analytics at scale, achieving an average 53% increase in labor productivity and a 26% reduction in conversion costs. New-product introduction time fell by 50%, material waste by 30%, and energy and water use by an average of 25%.2
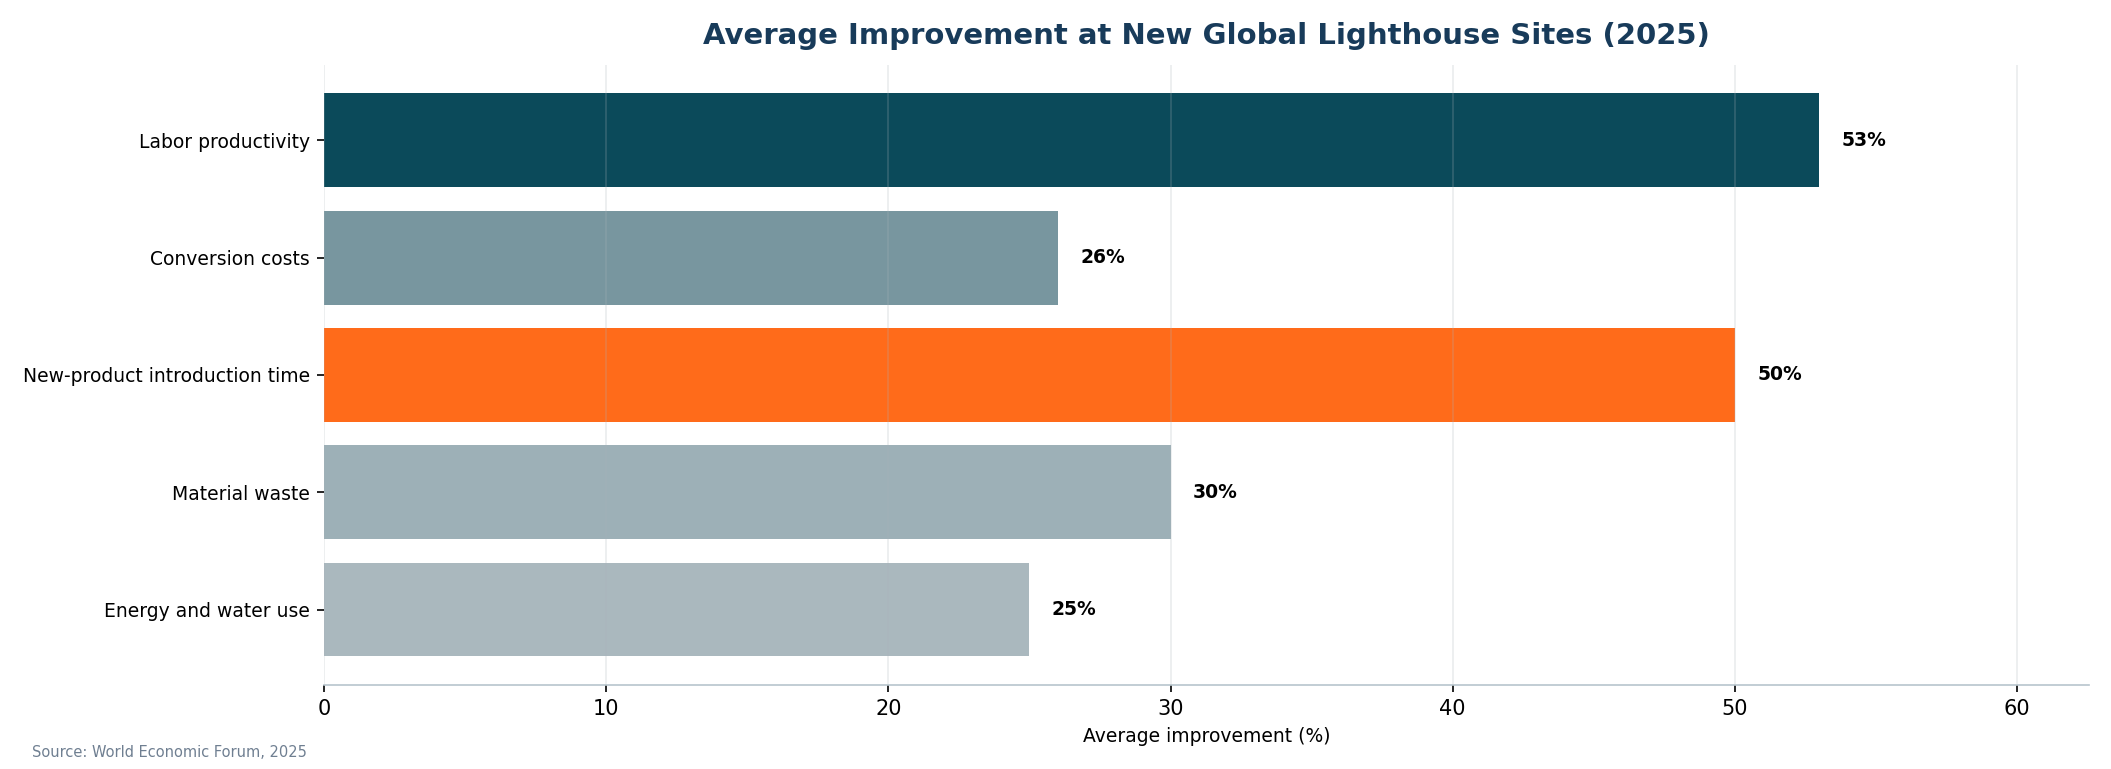
Figure 1. Average improvement achieved by new Global Lighthouse sites in 2025 Source: World Economic Forum, 2025 ·Original Source
The Numbers Point to “Operational Transformation,” Not Just “Technology Adoption”
These figures do not mean that every Smart Factory will achieve the same results. Global Lighthouse sites are leading facilities that have extended digital transformation into measurable gains in productivity and quality. The results therefore represent not an industry-wide average, but the level that can be reached when data and automation are carried all the way into day-to-day process operations.
High-performing facilities typically did not deploy a single technology in isolation. They collected equipment data, used AI to analyze anomalies and quality, and changed work standards and control conditions at the same time. Sensors and dashboards may have been the starting point, but the real impact occurred when data changed operator decisions and equipment behavior.
Operational Assets the Smart Factory Leaves Behind
| assets | content |
|---|---|
| Data assets | Equipment conditions and quality results are accumulated along a time axis and can be used for root-cause analysis and model training. |
| Work standards | Alarms, work instructions, and inspection results are recorded digitally, reducing differences in judgment among operators and shifts. |
| Integration foundation | MES, SCADA, PLC, and database systems are connected, allowing future AI prediction results to be delivered to shop-floor systems. |
| Performance measurement framework | Improvement effects can be verified quantitatively against KPIs such as OEE, FPY, defect rate, and Cycle Time. |
These four assets are also the building blocks of a Dark Factory. Autonomous manufacturing should not be approached by discarding the existing Smart Factory and rebuilding from scratch. Instead, prediction, decision, and execution capabilities should be added step by step on top of already connected data and systems.
Why Response Is Still Slow Even When the Factory Is Visible
A common shop-floor problem is not that “there is no data,” but that “it takes too long for data to become action.” Even when an equipment anomaly appears on a dashboard, response time is still governed by human speed if an operator must check the screen, search several systems for related data, interpret the cause, obtain managerial approval, and then change the conditions.
NIST notes that companies using manufacturing-data analytics may receive actionable results too late to create real impact. It also identifies the integration of analytics tools with data-acquisition and decision-support systems as a major technical barrier.3 Improving analytical accuracy alone is therefore not enough; the design must also define when the result is delivered, to which system, and who or what executes it.
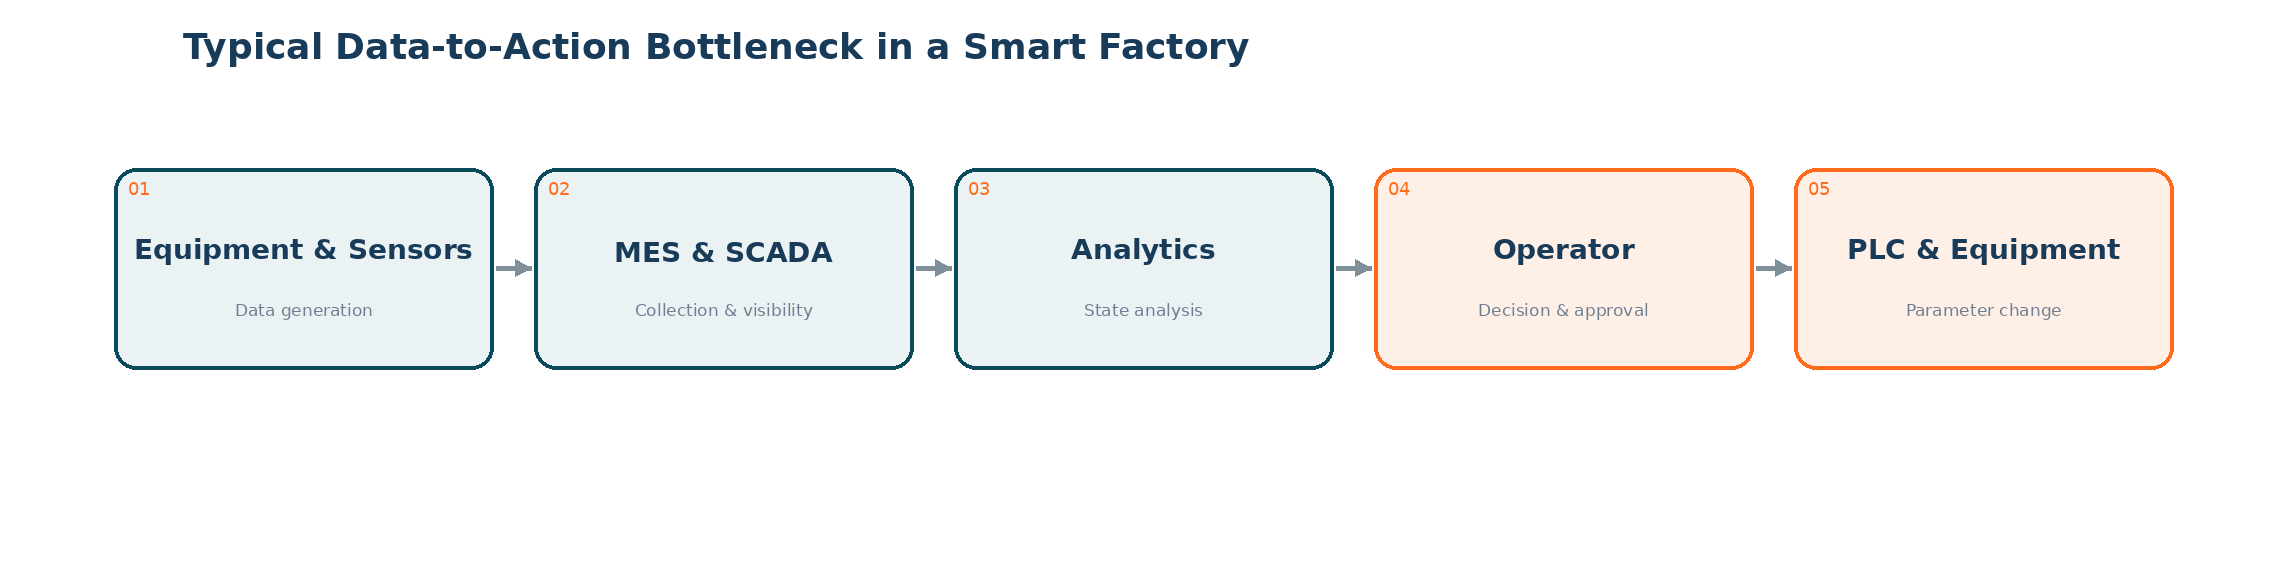
Figure 2. The data-to-action bottleneck in a typical Smart Factory Source: Reconstructed by ITIV AI
Four Bottlenecks That Remain After the Smart Factory
| Bottleneck | How it appears on the shop floor | Quantitative indicators |
|---|---|---|
| Insufficient data context | Values are collected but not linked to product IDs, operating conditions, or equipment states, making them difficult to use directly for root-cause analysis. | Missing-data rate, ID match rate |
| Analysis delay | Daily or weekly reports are useful for improvement activities, but too slow for process control that changes by the second or minute. | Detection delay, analysis time |
| Dependence on individual judgment | The same alarm may be interpreted and handled differently depending on operator experience and shift. | Decision variability, number of operator interventions |
| Disconnected execution systems | Prediction results are not connected to PLCs, robots, or MES, forcing operators to re-enter values or make manual adjustments. | Parameter-application time, automated execution rate |
Expert Judgment Is Valuable, but Difficult to Scale
This does not mean that experienced operators make poor decisions. In complex processes, they often synthesize many variables and exceptions rapidly. The problem is that when this reasoning is concentrated in individuals, it is difficult to replicate across the organization. Outcomes may vary by shift and experience level, and response may slow when the expert is absent.
When process variables increase into the dozens, it becomes difficult for people to consider every combination and time-delay effect simultaneously. The next stage of manufacturing AI should not eliminate expert knowledge; it should structure decision criteria as data and extend them in a repeatable form. People should manage objectives and safety boundaries, while AI handles repetitive monitoring, prediction, and parameter calculation.
Manufacturing Priorities Are Shifting from “Monitoring” to “Prediction and Quality”
In Rockwell Automation’s 2025 global survey of 1,560 respondents across 17 major manufacturing countries, 95% said they had invested in, or planned to invest in, AI and machine learning within the next five years. Fifty percent planned to apply AI and machine learning to quality management, and 48% expected to redeploy or hire additional employees as a result of Smart Manufacturing investment.4
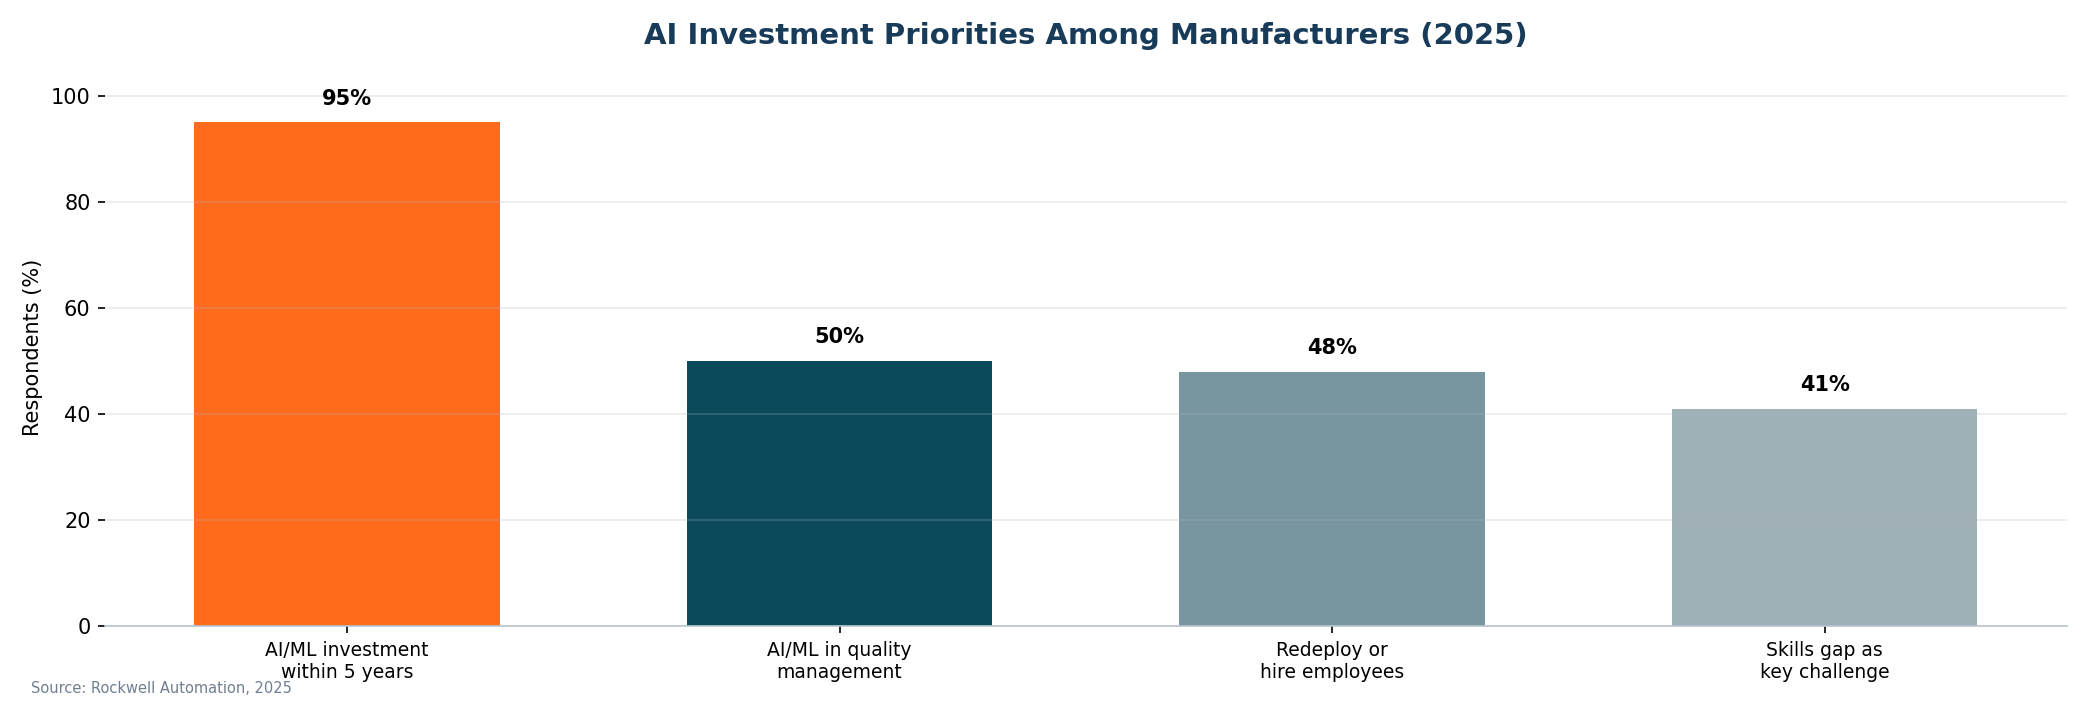
Figure 3. Manufacturer responses on AI investment and workforce planning in 2025 Source: Rockwell Automation, 2025 ·Original Source
Why Quality Management Is Often the First Application of AI
Quality management is an area in which the effects of AI adoption can be measured relatively clearly. Inspection results can be expressed as quantitative values such as OK/NG, defect type, defect size, location, and geometric deviation. Defect-detection rate, false-call rate, inspection time, and labor input can also be compared before and after deployment. This is one reason AI-based image analysis has spread first in quality applications.
To advance toward a Dark Factory, however, inspection cannot be the endpoint. Results must be linked to the equipment conditions under which they occurred, process states must be predicted before defects repeat, and the direction of change for adjustable variables must be recommended. When QC automation expands into process prediction and control, quality data becomes a feedback signal for the production system.
Case: When Vision Inspection and Process Control Are Connected
The CITIC Dicastal Morocco facility introduced by the World Economic Forum combined advanced casting and machining algorithms, AI-based vision inspection, and process controls that manage natural-gas quality variation. As a result, OEE increased by 17% and labor productivity by 27%, while defects decreased by 31.1% and Scope 1 and 2 emissions by 53%.5
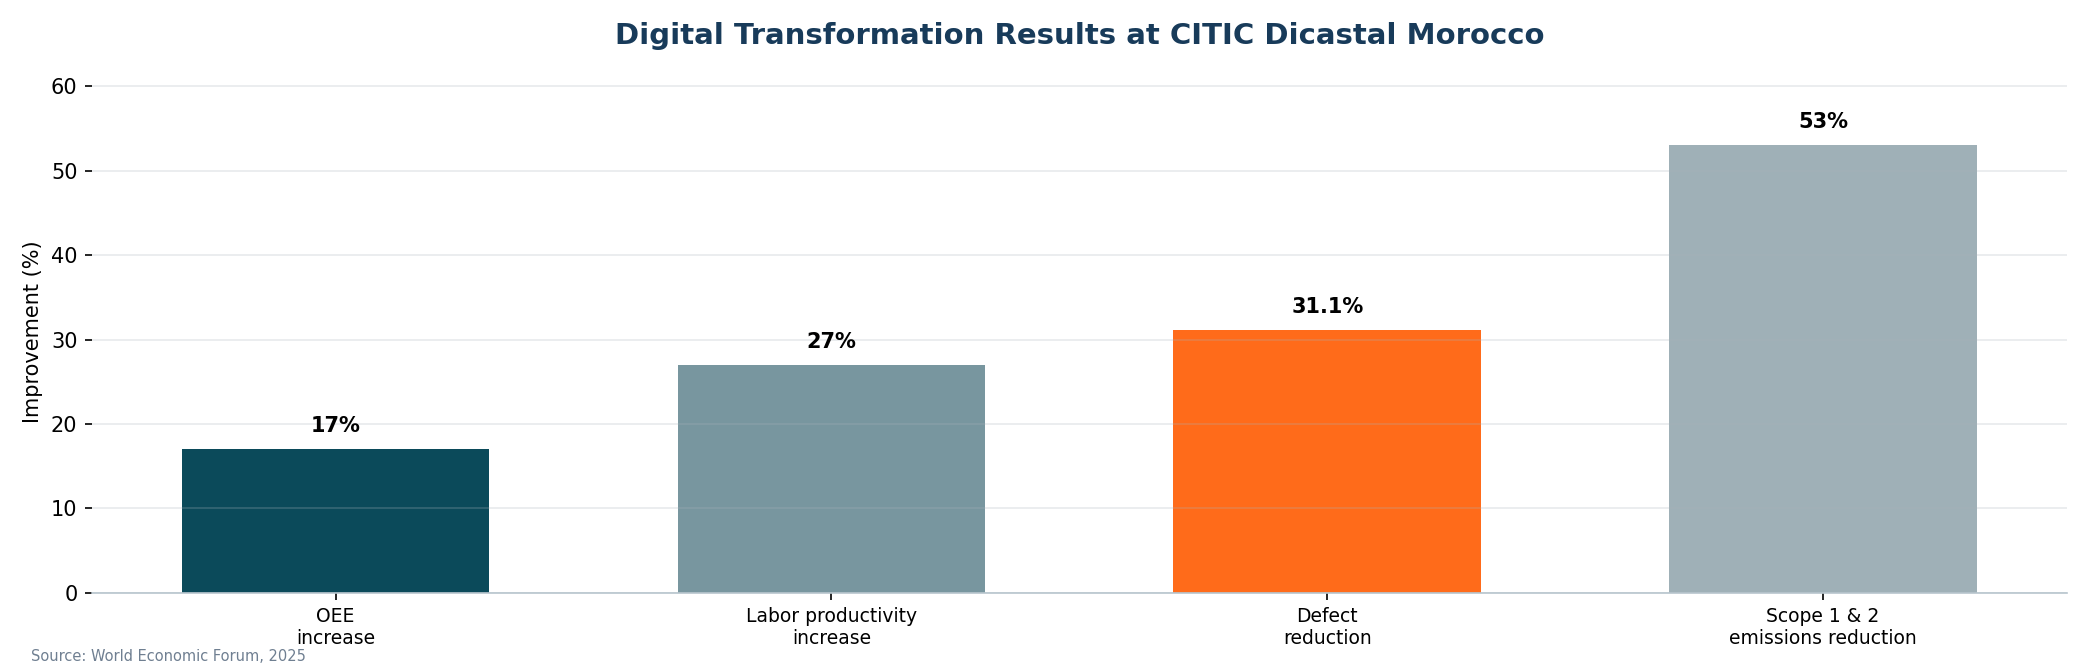
Figure 4. Results from combining AI vision inspection, advanced analytics, and process control Source: World Economic Forum, 2025 ·Original Source
The central lesson is not the accuracy of a particular AI model, but the fact that sensing, analysis, and control were connected as a single operating system. Vision inspection identifies defects, process analytics interprets causes and changing conditions, and the control system applies the result on the shop floor. When these elements are linked, quality, productivity, and environmental performance can improve together.
From Dashboards to Closed-Loop Operations
The transition from Smart Factory to Dark Factory cannot be defined only by whether a facility is unmanned. The more important question is how far data is allowed to intervene in operations. The progression begins with displaying data, then advances to predicting the future, recommending optimal conditions, and automatically executing actions within a safe operating envelope.
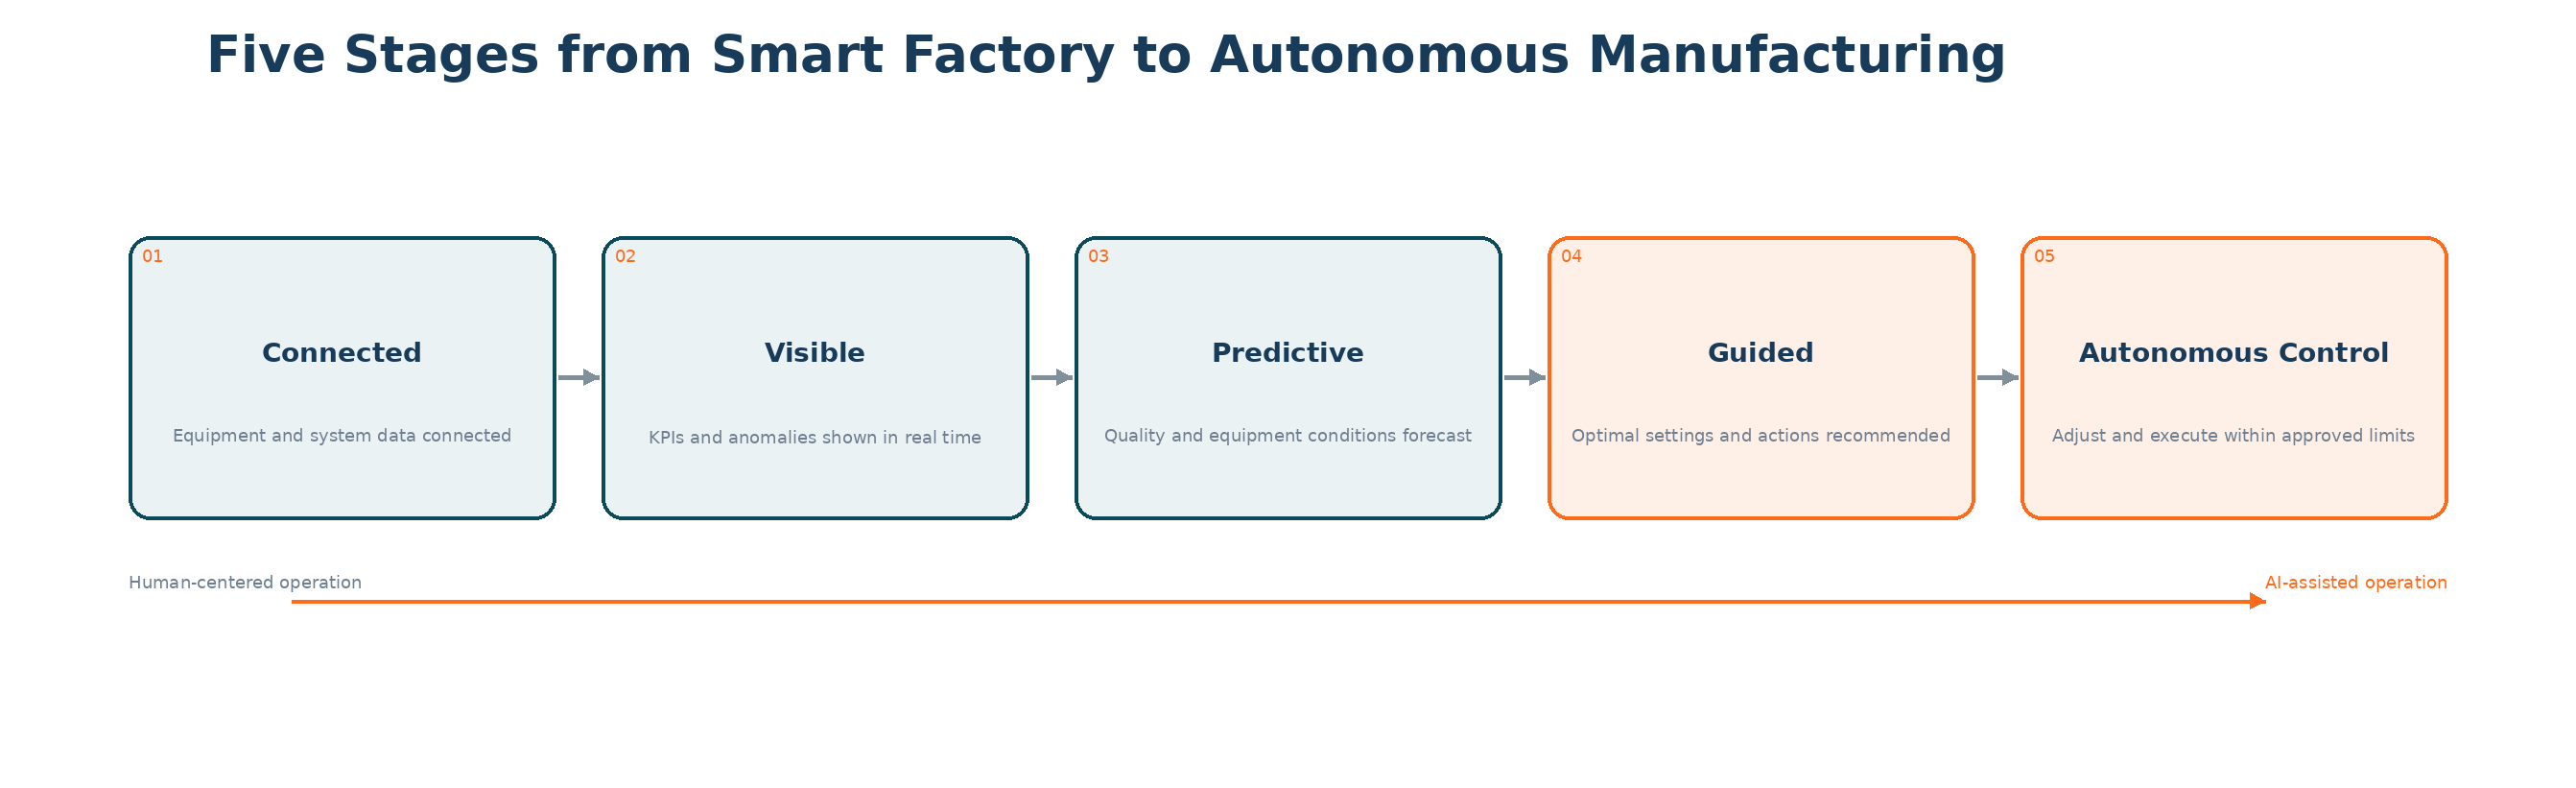
Figure 5. Five stages from Smart Factory to autonomous manufacturing Source: Reconstructed from ITIV AI’s technical perspective
Transformation Must Be Measured with “Operational KPIs,” Not Accuracy Alone
AI model accuracy is important, but model performance alone cannot determine business value in manufacturing. Even an accurate prediction will not improve operations if it arrives too late or is not used by operators. The following KPIs should therefore be managed together.
| KPI | What the KPI measures | Target direction for Dark Factory transformation |
|---|---|---|
| Detection latency | Time from the occurrence of an anomaly until the system recognizes it | Reduce to seconds or minutes |
| Decision lead time | Time from reviewing analytical results to deciding on an action | Automate repetitive decisions |
| Parameter-application time | Time from the action decision until values are applied to the PLC or equipment | Reduce through approval and control integration |
| Operator interventions | Number of times a person directly judges or enters data per production unit | Reduce under normal operating conditions |
| FPY, defect rate, OEE | Final results affecting quality and productivity | Continuously verify improvement |
| Prediction confidence | Prediction error and uncertainty range | Use to determine the level of control authority |
Where Is Our Factory Today? A 12-Point Self-Assessment
Score each item as 0 (not established), 1 (partially established), or 2 (in operation) to identify the current level and priority tasks quickly. This assessment is an illustrative framework developed from ITIV AI’s technical perspective and is not an official certification standard.
| Assessment item | Diagnostic question | Score |
|---|---|---|
| Data connectivity | Are equipment, sensor, quality, and production data connected by product ID and timestamp? | 0 · 1 · 2 |
| Real-time capability | Can anomalies and quality changes be identified within the time required for process response? | 0 · 1 · 2 |
| Predictive capability | Can current data be used to predict future quality and equipment conditions? | 0 · 1 · 2 |
| Decision standardization | Are cause-and-action criteria defined as rules and models rather than remaining solely in human experience? | 0 · 1 · 2 |
| Execution integration | Are guidance or control values transmitted to MES, PLCs, or robots? | 0 · 1 · 2 |
| Feedback learning | Are execution results stored and used to improve models and standards? | 0 · 1 · 2 |
Score interpretation 0–4: connectivity foundation stage | 5–8: advanced analytics and prediction stage | 9–12: readiness for guidance and autonomous control
Three Questions for Moving from Smart Factory to Dark Factory
The transition to a Dark Factory is not a project to make every process unmanned immediately. Starting from the Smart Factory assets already in place, manufacturers should answer the following three questions and expand in stages, beginning with processes that offer high impact and clearly defined safety boundaries.
| Question | |
|---|---|
| Q1 | Can AI detect anomalies and quality changes before a person checks the process state? |
| Q2 | Can current data predict future quality and equipment conditions and calculate optimal parameters? |
| Q3 | Can the calculated conditions be connected to equipment control within safety rules and an approval framework? |
ITIV AI’s View of the Transformation
ITIV AI defines the transition from Smart Factory to Dark Factory as “the process of turning shop-floor data into executable intelligence.” The first step is to collect and quantify image, sensor, and process data accurately. The second is for AI to predict quality and process outcomes and calculate the conditions required to achieve the target. The final step is to connect the calculated guidance to operators or to PLC, robot, and equipment-control systems.6
In this architecture, image analysis becomes the factory’s eyes for recognizing product and equipment conditions, while process-data inference becomes the brain that calculates future outcomes. AI Guidance recommends optimal conditions, and an AI Agent understands process data and work standards to plan the required actions. The key is not to separate these technologies into isolated solutions, but to design them as one flow of data acquisition, analysis, decision, execution, and learning.
Key Conclusion
The Smart Factory connected the factory and made it visible. The next competitive advantage will come from linking collected data to prediction, decision, and execution at the time it is needed—reducing repetitive human intervention under normal conditions while supporting faster and more consistent judgment in exceptional situations.
The next article will define the Dark Factory not simply as an “unmanned factory with the lights off,” but as an autonomous manufacturing system in which sensing, prediction, decision, execution, and learning are connected.
In Closing

Minyeop Kim | Head of Smart X Business Division, ITIV AI E. minyeop@itivai.com
“The Smart Factory has played a major role in connecting manufacturing operations and making them visible. The next task is to ensure that collected data leads to timely decisions and execution. The next stage of manufacturing competitiveness will be determined not by how much more data a company can collect, but by how quickly and consistently it can turn that data into action.”
※ External statistics summarize surveys and leading cases published by their respective organizations and do not guarantee the performance of any individual factory. The self-assessment and maturity stages are illustrative models reconstructed from ITIV AI’s technical perspective.
References and Sources
External figures and cases used in this article were compiled from official publications by institutions and companies. ITIV AI recreated the charts visually from the original data, and the source title and original link are shown beneath each figure.
Bibliography
Footnotes
-
NIST, “Data Analytics for Smart Manufacturing Systems,” updated 2025. Reference: the role of Smart Manufacturing in transforming manufacturing data into actionable knowledge and supporting decision-making. Link ↩
-
World Economic Forum, “Global Lighthouse Network 2025: World Economic Forum Recognizes Companies Transforming Manufacturing through Innovation,” 2025. Reference: average improvements in labor productivity, cost, lead time, and resource use at new Lighthouse sites in 2025. Link ↩
-
NIST, “Data Analytics for Smart Manufacturing Systems,” updated 2025. Reference: delays in analytical results and technical barriers to integrating analytics, data acquisition, and decision-support systems. Link ↩
-
Rockwell Automation, “2025 State of Smart Manufacturing Report” presentation, 2025. Reference: AI and ML investment, quality-management adoption, and workforce plans among 1,560 manufacturing respondents in 17 countries. Link ↩
-
World Economic Forum, same source. Reference: results from AI vision inspection, advanced analytics, and process control at CITIC Dicastal Morocco. Link ↩
-
ITIV AI, “AI Solutions Overview,” 2026. Reference: the solution direction linking image, sensor, and process-data acquisition with AI analysis, guidance, and equipment execution. Link ↩