TECH CONTRIBUTION SERIES ⑥ — SMART FACTORY → DARK FACTORY
Expanding data, prediction, guidance, and control in a sequence that proves results—rather than making the entire factory unmanned at once
3-Second Summary
- A Dark Factory is a staged transformation / The path expands from a data foundation to inspection automation, prediction, Guidance, limited autonomy, and multi-process autonomy.
- The first PoC must have clear impact and control / Select a process with significant recurring loss, available data, adjustable variables, and a definable safety envelope.
- Results must be proven through operational KPIs / Manage not only accuracy, but also defect rate, Cycle Time, interventions, energy, OEE, and payback period.
A Dark Factory Is a Transformation Process, Not a Finished Product
Many companies have pursued Smart Factory programs and built equipment connectivity, MES and SCADA, sensors, dashboards, and automated equipment. Dark Factory transformation is not a project that discards these assets and builds an entirely new factory. It is a process of adding AI vision, process prediction, AI Guidance, and AI Agents step by step on top of existing data and control systems to reduce repetitive human decisions and manual operation.
If the entire factory is targeted from the beginning, data quality, equipment integration, organizational roles, and safety validation become complex at the same time. By contrast, when a clear KPI is established in one process and the data, model, and execution architecture are standardized, the capability can be replicated across other lines and processes. The core of a transformation roadmap is therefore not a list of technologies, but the sequence and promotion criteria.
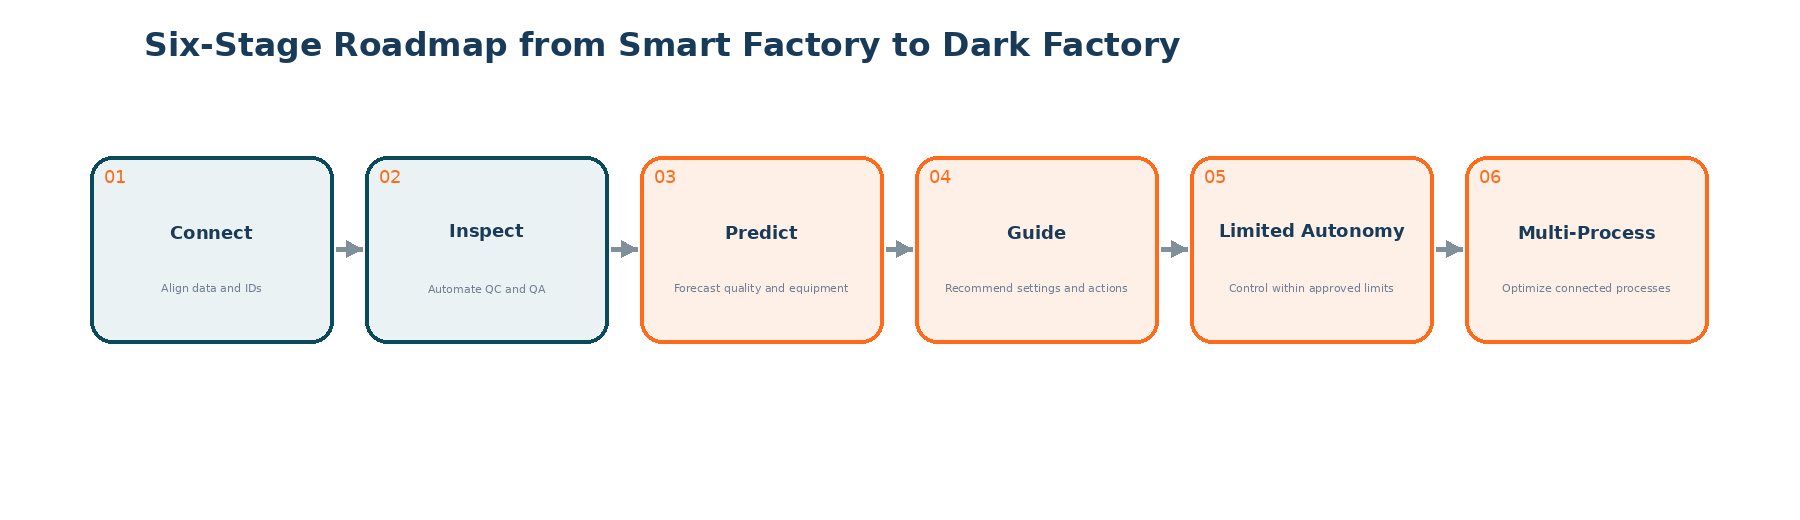
Figure 1. Six-stage transformation model from data connectivity to multi-process autonomous operations Source: Reconstructed by ITIV AI
Stage 1: Connect Data by Product and Process
Even large volumes of equipment data are difficult to use for quality root-cause tracing if timestamps and product IDs do not match. The first stage connects PLC, sensor, camera, MES, inspection-equipment, and work-history data on the same time axis and by product, lot, and equipment ID. Missing-data rate, acquisition interval, units, sensor calibration, and data latency should be standardized, and change history should be managed.
Success at this stage is measured not by the number of dashboard screens, but by data usability. Indicators such as key-variable collection rate, product-ID match rate, data latency, and missing-data recovery time must be managed so that later AI models use the same information available on the shop floor.
Stage 2: Quantify Quality and Equipment Conditions Automatically
Convert appearance, geometry, temperature, and equipment conditions that were previously judged by eye into 2D, 2.5D, 3D, thermal, and sensor data. Inspection results should include not only OK/NG, but also defect location, size, height, temperature, anomaly score, and source-image history. Repeatable measurement against the same criteria is necessary to compare quality variation and improvement effects across processes.
Stage 3: Predict Quality and Equipment Conditions Before Outcomes Occur
Use past and current process data to infer future quality, defect probability, equipment anomalies, and energy use. Validate the prediction target, lead time, data leakage, and reproducibility by product and period. At this stage, model accuracy must be evaluated together with whether the result arrives before the point at which the process can still be adjusted.
Stage 4: AI Guidance Recommends Optimal Conditions and Actions
Calculate the gap between predicted values and target specifications and recommend decrease, hold, increase, or specific settings while considering adjustable variables and constraints. In the beginning, operators approve recommendations and record outcomes. Validate recommendation usage, approval rate, post-adjustment quality improvement, and reduction in operator-to-operator variability.
Stage 5: Begin Limited Autonomous Control Within a Safe Range
Automate first under highly repeatable conditions with clearly defined risk ranges. AI commands pass through a policy engine and interlocks, verify equipment-specific limits, product specifications, and user authority, and only then execute. If communication fails, model confidence falls, or sensors report errors, the system returns to recommendation mode or manual operation.
Stage 6: Connect Multiple Processes and Objectives for Autonomous Operations
The condition that optimizes one process may be unfavorable for quality or energy in the next. Multi-process autonomy considers quality, output, delivery, energy, and equipment life simultaneously, while reflecting time delays and work-in- process flow between processes. People manage objectives, policies, safety limits, exceptions, and investment priorities.
Leading Factories Improve Multiple KPIs, Not a Single Technology Metric
The World Economic Forum’s September 2025 cohort of new Lighthouse sites recorded an average 40% increase in labor productivity and a 48% reduction in lead time. Major use cases applying AI and generative AI achieved results including a 41% reduction in product defects, 28% lower energy consumption, and 44% shorter Cycle Time.1
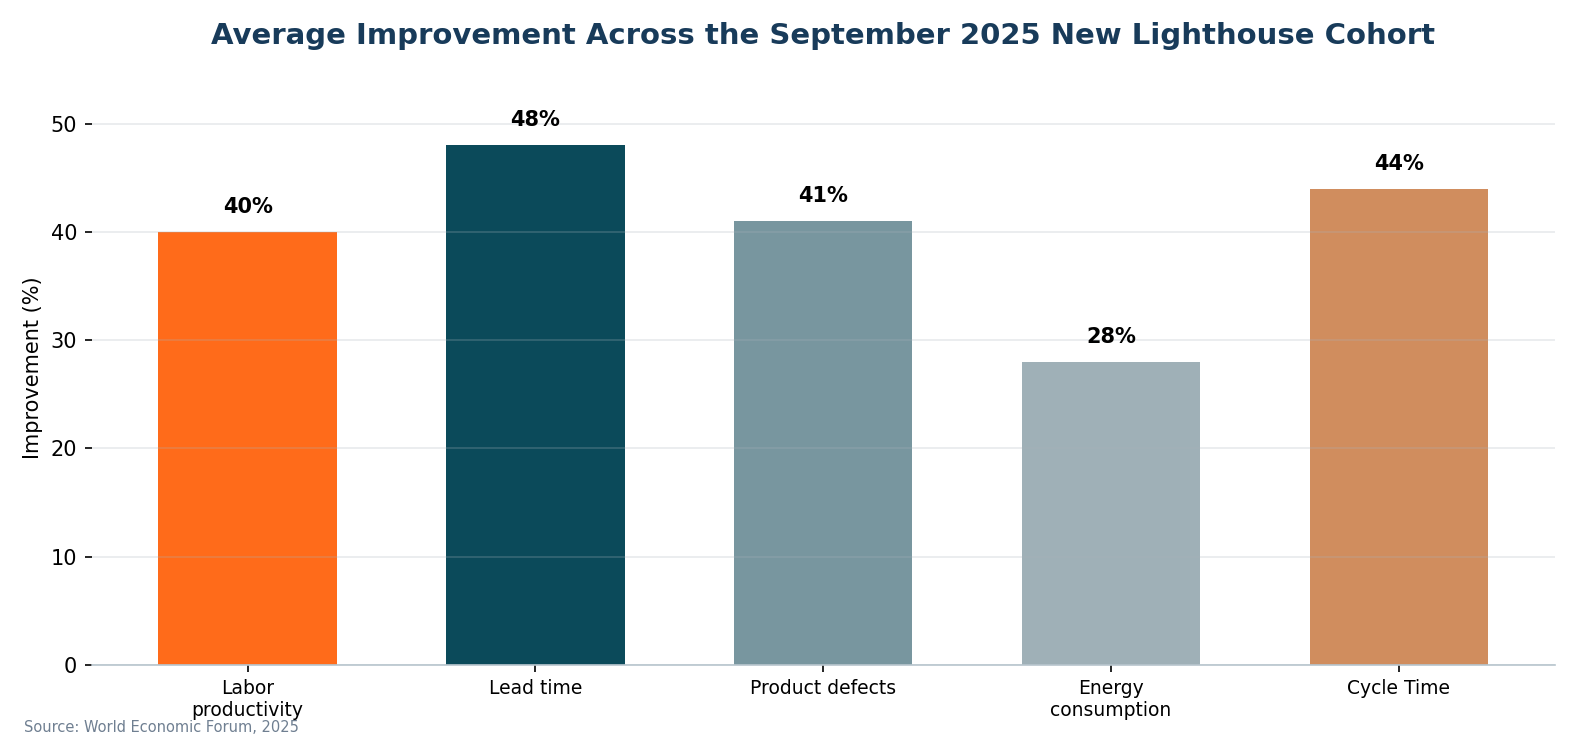
Figure 2. Average improvements at new Global Lighthouse sites Source: World Economic Forum, 2025 Original Source
These results do not mean that deploying one technology will create the same performance everywhere. Lighthouse sites typically combine more than 10–30 use cases with organizational and operational innovation and are assessed on verified impact across multiple KPIs.2 Dark Factory transformation should likewise be approached not as the purchase of a camera, AI model, or robot, but as the development of repeatable operational capability.
Select the First PoC Process for Business Impact and Controllability, Not Technical Difficulty
| Evaluation item | Question | Example scoring criteria |
|---|---|---|
| Economic loss | Are defect, rework, downtime, or energy losses recurring? | Low 1 / Medium 3 / High 5 |
| Data readiness | Are quality outcomes connected to data on possible causes? | None 1 / Partial 3 / Sufficient 5 |
| Measurability | Can results be compared numerically against a baseline? | Ambiguous 1 / Partial 3 / Clear 5 |
| Adjustability | Are there process variables that can be changed based on AI results? | None 1 / Limited 3 / Clear 5 |
| Safety and authority | Can the automatic-execution range and interlocks be defined? | Difficult 1 / Conditional 3 / Clear 5 |
| Scalability | Can the solution be expanded to other products, lines, or factories? | One-off 1 / Partial 3 / High 5 |
The process with the highest score is not always the easiest. However, when economic value, data readiness, and execution feasibility are all high, the probability of moving from PoC to operation is greater. Conversely, a process may have abundant data yet remain an analytical project if there is no adjustable variable or if outcomes are confirmed only months later.
Design the PoC as an Operational Promotion Process, Not a 90-Day Analysis
| Period | Core activity | Completion criterion |
|---|---|---|
| Weeks 0–4 | Define the problem, KPIs, data, equipment integration, and safety range | Confirm baseline, data dictionary, owner, and approval procedure |
| Weeks 5–8 | Quantify sensor and image data, develop the model, and validate offline | Complete performance review by period and product and check data leakage |
| Weeks 9–12 | Shadow operation, operator recommendations, and result comparison | Validate real-time latency, usability, and operational KPIs |
| Months 3–6 | Approved execution or limited automatic control | Long-duration run including safety blocks, recovery, and audit logs |
| After 6 months | Replicate to lines, standardize models and settings, and connect multiple processes | Secure reusable data, model, and integration packages |
Timing will vary by process and data conditions. The important point is not to treat completion of model development as the end of the PoC. Actual data latency and operator usability should be verified in shadow operation, approval and execution results should be accumulated, and only then should automatic-control authority be expanded.
Measure Technology, Operations, Finance, and Safety Together
| Area | Representative KPI | Dark Factory perspective |
|---|---|---|
| Technology | Detection rate, MAE, RMSE, latency, availability, and drift | Can AI reproduce performance under the same conditions over the long term? |
| Quality | Defect rate, rework, process capability, and customer claims | Does the system move from after-the-fact detection to prevention? |
| Production | OEE, Cycle Time, lead time, and output | Are decision and adjustment waiting times reduced? |
| People | Intervention frequency, approval rate, handover time, and exception-handling time | Does repetitive judgment decrease while people move to higher-value work? |
| Energy and equipment | Energy per unit, downtime, MTBF, and MTTR | Is performance optimized without harming quality and productivity? |
| Finance | Savings, additional output, investment cost, and payback period | Does the technical effect translate into financial performance? |
| Safety and control | Interlock activation, manual recovery, authority violations, and audit logs | Does autonomous authority expand only within a verifiable range? |
Do Not Separate the Data Team from the Shop-Floor Team
A Dark Factory is not an AI-team-only project. Production defines objectives and constraints, quality sets specifications and validation criteria, and equipment and control teams design PLC, interlock, and recovery procedures. IT and data teams manage acquisition, storage, access, and model operations, while safety teams review automation authority and risk assessment.
When these roles work separately and hand tasks off sequentially, the meaning of data and shop-floor constraints are discovered too late. From the beginning of the PoC, process owners, operators, quality, equipment and control engineers, and AI developers should share the same KPIs and data definitions. It is also effective to operate separate approval gates for model-performance review and shop-floor operational review.
Scaling Means Reusing Operational Assets, Not Copying a Model
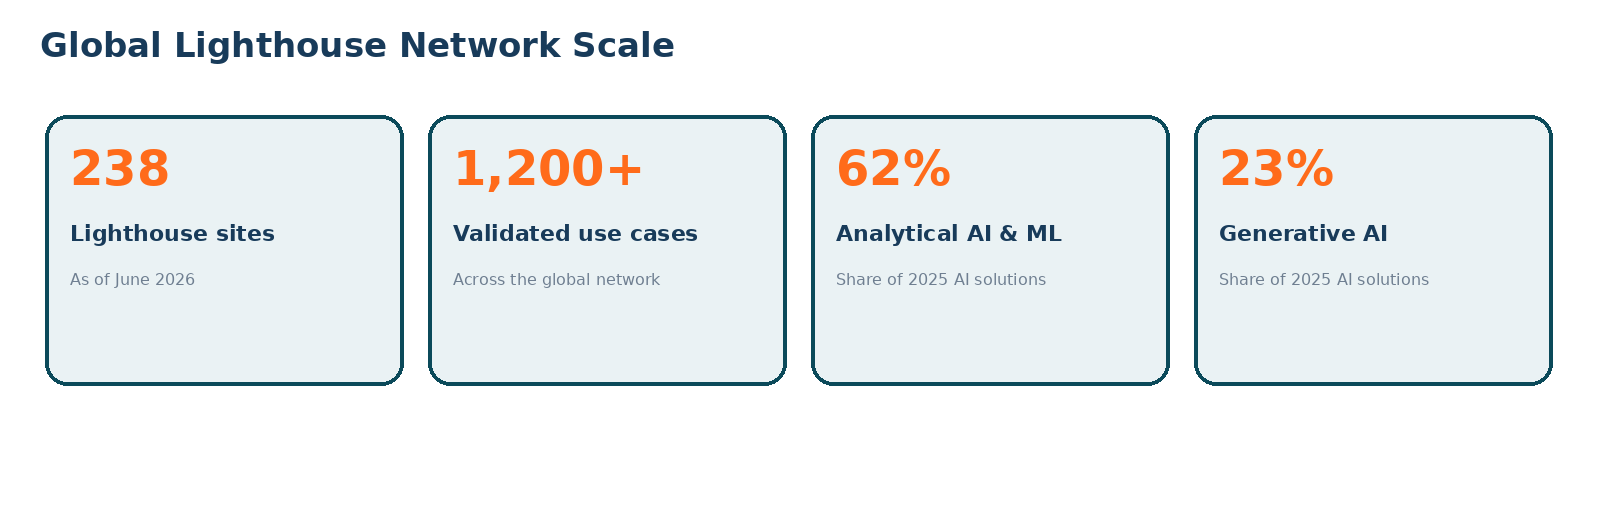
Figure 3. Scale of the Global Lighthouse Network and its use of AI in 2026 Source: World Economic Forum, 2026 Original Source
The World Economic Forum reported that as of June 2026, the network had expanded to 238 production sites and more than 1,200 validated use cases.3 A common characteristic of leading companies is that they do not leave use cases as one- off projects. They turn data models, KPIs, user interfaces, integration functions, training, and operating procedures into reusable assets.
Copying a model that succeeded on one line directly to another can fail because equipment and product conditions differ. Instead, organizations should standardize data schemas, camera and sensor selection procedures, model-validation methods, API and PLC interfaces, and authority and audit policies, while revalidating only site-specific parameters and models.
The Dark Factory Technology Stack Connected by ITIV AI
| Layer | ITIV AI role | Primary outputs |
|---|---|---|
| Shop-floor sensing | Acquire 2D, 2.5D, 3D, thermal, sensor, and process data | Images, Point Clouds, temperature, process variables, and product IDs |
| ITIV CAM | Quantify image and sensor data and perform AI judgment | OK/NG, defect location, size, geometry, anomaly score, and history |
| AI Guidance | Infer future outcomes from past and current data and optimize conditions | Quality prediction, risk, decrease/hold/increase direction, and recommended value |
| AI Agent | LLM- and RAG-based knowledge understanding, planning, and tool calls | Evidence-based explanation, approval requests, and MES, database, PLC, and robot execution |
| Operations and learning | Manage models, data, authority, logs, and KPIs | Drift, versions, audit history, improvement effects, and replication packages |
The Dark Factory envisioned by ITIV AI is not delivered as a single camera or AI model. It is an end-to-end flow that quantifies shop-floor conditions accurately, predicts process outcomes, converts them into guidance and commands that operators and equipment can use, and learns again from execution results.
Series Conclusion
The Smart Factory connected the factory and made it visible; the Dark Factory turns connected data into prediction, decision, and execution. Successful transformation is not a declaration of unmanned operation, but a process of replicating validated closed-loop operating capability step by step from small processes.
In Closing

References and Sources
External figures and cases in this article were compiled from official publications by institutions and companies and from the supplied product brochures. ITIV AI visually reconstructed the charts and diagrams from the original figures or technical structures.
Bibliography
- NIST, “2026 Roadmap on Artificial Intelligence and Machine Learning for Smart Manufacturing”. Reference: efficiency, adaptability, and autonomy in AI manufacturing, together with integration, reliability, safety challenges, and the technical roadmap. Link
- NIST, “Operations-driven Performance Measurement for Smart Manufacturing Systems”. Reference: the importance of productivity, quality, and sustainability KPIs in measuring Smart Manufacturing performance. Link
- NIST, “SP 800-82 Rev. 3: Guide to Operational Technology Security”. Reference: OT performance, reliability, safety requirements, and security principles when expanding autonomous control. Link
- ITIV AI, “AI Solutions Overview.” Reference: connecting data acquisition, prediction, guidance, and execution through ITIV CAM, AI Guidance, and AI Agents. Link
※ The six-stage roadmap, PoC scoring table, and suggested timing are illustrative examples for explaining deployment direction. Actual schedules and promotion criteria vary with process risk, data readiness, and customer operating rules.
Footnotes
-
World Economic Forum, “Global Lighthouse Network 2025: 12 New Sites”. Reference: average productivity and lead-time improvements in the new cohort, and defect, energy, and Cycle Time results from AI use cases. Link ↩
-
World Economic Forum, “Global Lighthouse Network Application FAQ”. Reference: the criterion that Lighthouse sites typically require more than 10–30 use cases and verified impact across multiple KPIs. Link ↩
-
World Economic Forum, “Global Lighthouse Network: Transforming advanced manufacturing”. Reference: 238 Lighthouse sites, more than 1,200 use cases, 62% analytical AI and ML, and 23% generative AI in 2026. Link ↩