TECH CONTRIBUTION SERIES ④ — SMART FACTORY → DARK FACTORY
From AI that checks inspection results to AI that calculates optimal conditions before outcomes occur
3-Second Summary
- Prediction must define both the future point and the action / It must be clear what will be predicted, how many minutes or process steps ahead, and when which variable can be changed.
- Check data leakage and operational latency before accuracy / Variables created after the outcome or data that arrives too late cannot be used on the shop floor, even if they produce high test performance.
- AI Guidance turns predictions into adjustment values / It calculates the gap between the target and the current prediction and recommends decrease, hold, or increase directions within a safe range.
Inspection Automation and Process Prediction Start from Different Questions
Vision inspection judges the current condition of a product or piece of equipment. Process prediction calculates quality and equipment conditions that have not yet appeared. Detecting a defect after the product is complete may prevent escape, but it cannot recover the raw material, time, or energy already consumed. Predicting quality deviation before the result is fixed, by contrast, allows process conditions to be adjusted so that defects can be prevented.
The purpose of a predictive model is not simply to match a future number. It is to secure enough lead time for an operator to act and to connect the prediction to adjustable variables so that the process outcome moves toward the target range. The prediction target, prediction point, controllable variables, allowable error, and execution owner should therefore be defined before model development begins.
Define the Prediction Problem with Five Questions
- What will be predicted? / Define the target numerically, such as final quality, defect probability, equipment-anomaly score, or energy use.
- How far ahead should the prediction be made? / Define the minimum lead time needed for an operator to review the result and change equipment conditions.
- Which data exists at that point in time? / Exclude values generated after the outcome and any information from the future.
- What can be changed? / Separate truly controllable variables such as speed, temperature, pressure, input quantity, and duration.
- What failures are acceptable? / Define error tolerance, safety limits, manual fallback, and exception-handling criteria.
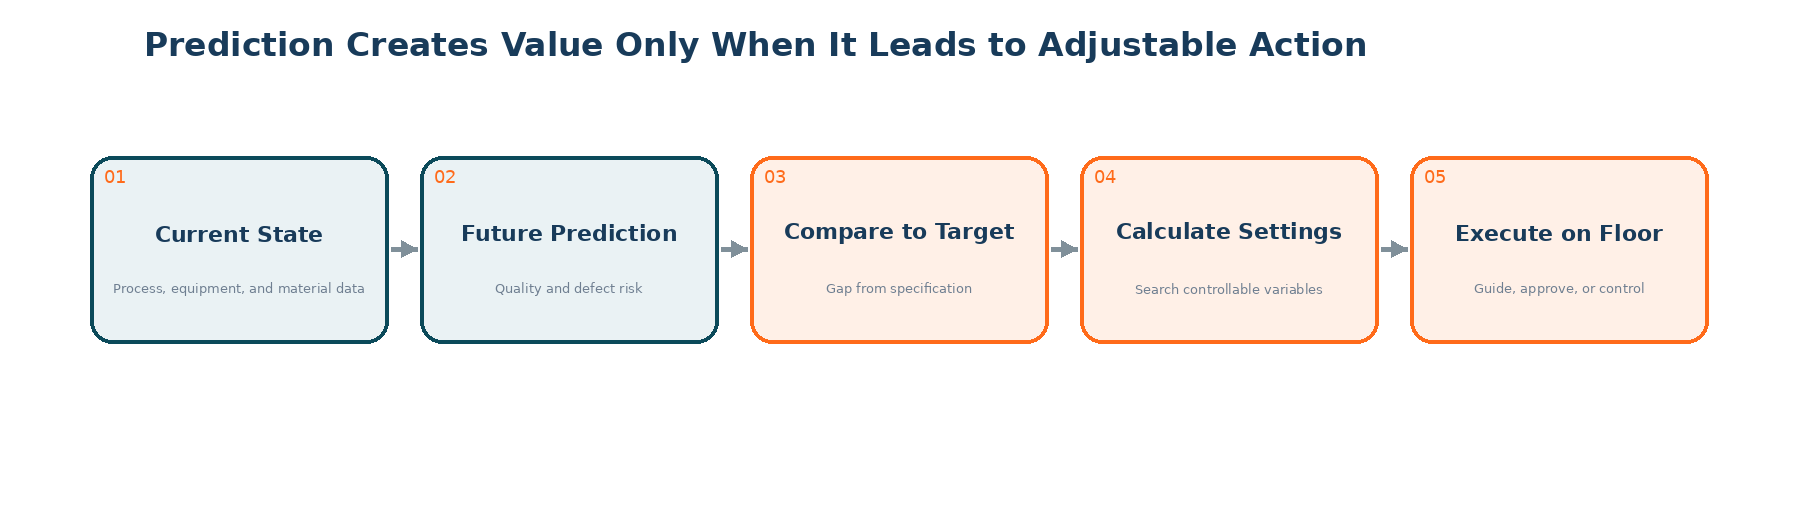
Figure 1. Prediction and optimization flow from process data to AI Guidance Source: Reconstructed by ITIV AI
The Most Dangerous Source of High Accuracy: Data Leakage
Data leakage occurs when information that would not be available at the prediction point is included in training or input data. For example, a correction value calculated together with the final inspection result, an input quantity finalized after the work is completed, or an operator action recorded after quality judgment may improve test performance, yet none of these values would be available during actual operation.
| Category | Incorrect configuration | Correct configuration |
|---|---|---|
| Time basis | Randomly mix all data for training and evaluation | Separate future periods by time order or production lot |
| Input variables | Include values generated after the outcome | Use only variables confirmed before the prediction point |
| Duplicate data | The same product or consecutive samples appear in both training and evaluation sets | Separate groups by lot, equipment, and period |
| Operational latency | Assume values entered late into the database are real-time inputs | Validate using actual acquisition and transmission delays |
| Model selection | Repeatedly tune against the test set | Select using a validation set and evaluate the test set only once at the end |
Manufacturing data is continuous in time and repeatedly generated by the same equipment and products. Standard random splitting can therefore overestimate performance. Evaluation must distinguish whether the model merely remembers samples similar to the past or can reproduce performance in new periods, steel grades, products, and equipment conditions.
Model Evaluation Should Examine the Structure of Error, Not a Single Score
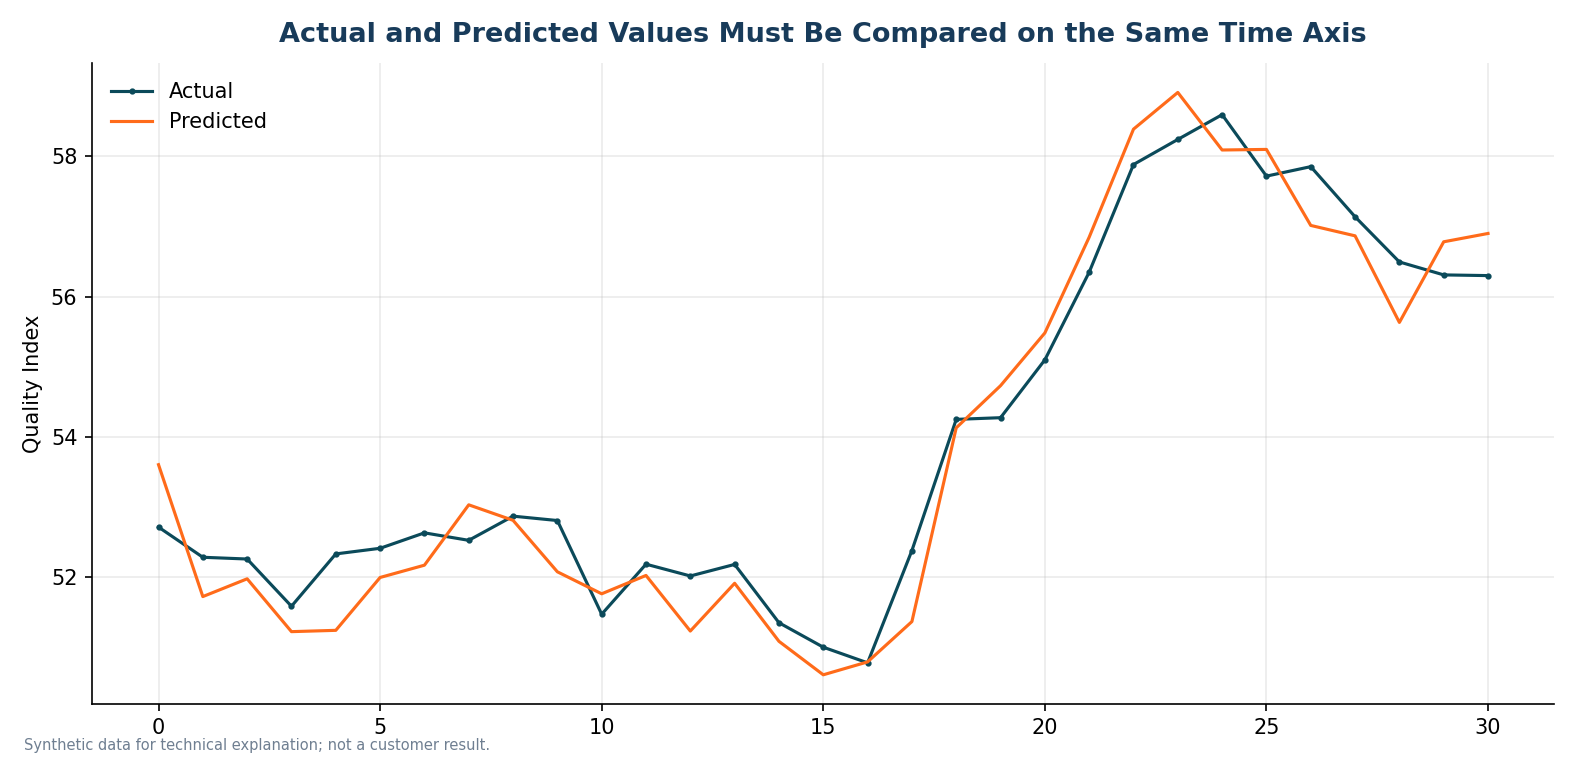
Figure 2. Example comparison of actual and predicted time-series values ※ Synthetic data for technical explanation
| Metric | Meaning | Shop-floor interpretation |
|---|---|---|
| MAE | Mean absolute error | Provides an intuitive view of how many units the quality value deviates on average |
| RMSE | A metric that penalizes large errors more heavily | Appropriate for processes where occasional large errors are especially important |
| R2 | Proportion of variance explained by the model | Use caution when interpreting it alone if the range is narrow or the distribution changes |
| Out-of-specification recall | Share of actual deviations detected by the model in advance | An important operating metric when the objective is defect prevention |
| False Alarm | Share of normal cases in which the system requests an action | Directly affects operator fatigue and unnecessary parameter changes |
| Lead time | Time secured before the outcome is finalized | Determines whether model output can support a real action |
Even when average error is small, error may increase near specification limits or bias may appear for particular products, shifts, or equipment. In addition to overall performance, results should be separated by steel grade, product, equipment, shift, and period, and performance in out-of-specification regions should be reviewed separately from normal regions.
Results Improve When Prediction, Virtual Sensors, and Vision Inspection Are Applied Together
Huafon Chongqing Spandex, introduced by the World Economic Forum in 2026, deployed 62 digital applications, including AI-based high-precision process optimization, virtual sensing, AI vision inspection, digital twins, robots, IoT, and big-data analytics. Quality defects decreased by 35%, labor productivity increased by 60%, and net profit margin increased by 113%.1
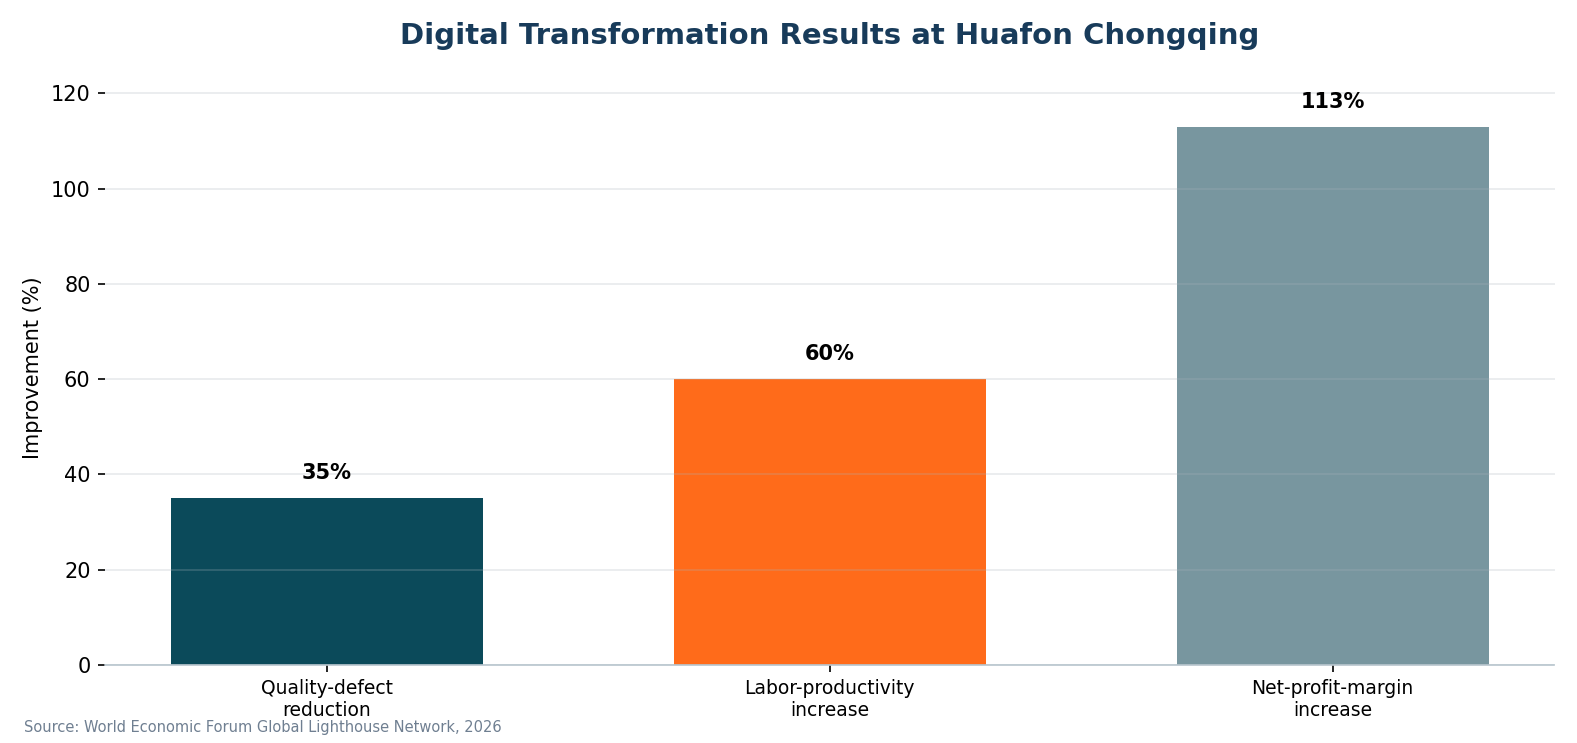
Figure 3. Results from combining process optimization, virtual sensors, and vision inspection Source: World Economic Forum, 2026
These figures are not the result of a single AI prediction model; they reflect the combination of many digital use cases and operational innovations. They nevertheless show that in autonomous manufacturing, prediction should not remain an isolated analytical report. It must be connected to virtual sensors, vision inspection, digital twins, and process control.
Virtual Sensors Estimate Values That Are Difficult to Measure Directly
Not every quality value can be measured directly in real time. Laboratory results may arrive tens of minutes later, or sensors may not operate reliably in environments with high temperature, dust, or vibration. A Virtual Sensor, also called a Soft Sensor, estimates difficult-to-measure quality values from surrounding process data such as temperature, pressure, input quantity, current, and time.
The purpose of a virtual sensor is not to replace physical sensors unconditionally. It fills gaps between measurement cycles, identifies periods with a high probability of abnormality, and provides early response time before a measured value arrives. Once the actual measurement is available, it should be compared with the prediction to monitor bias and drift.
AI Guidance Converts Predictions into Process Conditions
| Stage | Input | Processing | Output |
|---|---|---|---|
| 1. State estimation | Current process, equipment, and raw-material data | Handle missing values and outliers, calculate state features | Current-state vector |
| 2. Outcome prediction | Current state + process history | Infer quality, defect probability, and equipment condition | Future outcome and uncertainty |
| 3. Target comparison | Prediction + target specification | Calculate deviation from target and risk | Whether adjustment is required |
| 4. Parameter search | Adjustable variables + constraints | Combine simulation, optimization, and rules | Decrease, hold, increase, or a recommended value |
| 5. Execution and verification | Recommendation + approval and interlocks | Operator guidance or limited control | Execution history and outcome feedback |
A recommended value is not simply a move in the opposite direction of the prediction. Variable interactions, response delays, equipment limits, product specifications, and safety ranges must all be considered. AI Guidance therefore includes not only the predictive model, but also constraints, process rules, optimization logic, and an approval framework.
Model Drift That Must Be Managed During Operation
- Data drift / The distribution of raw-material, product, or equipment conditions differs from the distribution at the time of training.
- Performance drift / Changes in the input distribution lead to higher actual prediction error and lower out-of-specification detection performance.
- Concept drift / The relationship between the same inputs and outcomes changes because of equipment replacement, process changes, or seasonal effects.
- Operational drift / Operators do not use recommendations or intervene in different ways, causing model behavior and actual operations to diverge.
Drift is not solved simply by retraining a model. Process-change history, sensor calibration, data quality, and user-approval rates must be recorded together so that the cause can be distinguished. Performance by model version, deployment date, and applicable process range should be managed, and an operating policy should automatically suspend control and return to recommendation mode when thresholds are exceeded.
PoC Success Is Defined by Operational Decisions, Not Model Accuracy Alone
| Area | Core PoC KPI | Example decision criterion |
|---|---|---|
| Model | MAE, RMSE, out-of-specification recall, and false alarms | Lower error than the existing judgment and ability to detect deviations in advance |
| Time | Data delay, inference time, and lead time | Provide results before the point at which adjustment is still possible |
| Shop floor | Recommendation usage rate, approval rate, and number of interventions | Operators understand and use the system repeatedly |
| Quality | Defect rate, rework, variability, and process capability | Statistically meaningful improvement versus the pre-deployment baseline |
| Operations | Model availability, missing-data rate, and drift alerts | Maintain stable data and services over the long term |
Key Conclusion
The value of process-prediction AI does not end with matching a future number. It becomes the factory’s brain only when it secures time to act before the outcome is fixed and connects adjustable variables with safety constraints to reduce quality variation.
In Closing

References and Sources
※ External figures and cases in this article were compiled from official publications by institutions and companies and from the supplied product brochures. ITIV AI visually reconstructed the charts and diagrams from the original figures or technical structures.
Bibliography
- NIST, “2026 Roadmap on Artificial Intelligence and Machine Learning for Smart Manufacturing”. Reference: industrial big data, prediction, digital twins, and challenges involving explainability, reliability, and safety. Link
- NIST, “Data Analytics for Smart Manufacturing Systems”. Reference: feedback loops and integration needed to connect manufacturing-data analytics with decisions and action. Link
- NIST, “Considerations and Recommendations for Data Availability for Data Analytics for Manufacturing”. Reference: the importance of data quality, reliability, efficiency, and format for manufacturing analytics. Link
- ITIV AI, “AI Solutions Overview.” Reference: the AI Guidance approach that infers future outcomes from past and current process data and recommends optimal conditions. Link
※ The actual-versus-predicted chart uses synthetic data to explain model-evaluation methods and does not represent the performance of a specific customer or project.