TECH CONTRIBUTION SERIES ③ — SMART FACTORY → DARK FACTORY
Quantifying product and process conditions by combining 2D, 2.5D, 3D, thermal, and sensor data
3-Second Summary
- The inspection objective determines the data method / 2D is effective for color, presence, and position; 2.5D for subtle surface defects; and 3D for height, shape, and volume.
- Good AI begins with good input / If lighting, resolution, FOV, and Cycle Time are unstable, model accuracy will also be difficult to maintain on the shop floor.
- Images must become process data / Beyond OK/NG, defect location, size, height, temperature, and history must be connected to PLC, MES, and database systems.
Before AI Can Control a Factory, It Must See the Shop Floor Accurately
On the shop floor, people judge conditions by combining product color, surface, geometry, motion, temperature, and sound. AI is no different. No matter how advanced the model architecture is, results will fluctuate with lighting changes, product position, reflectance, and equipment vibration if cameras and sensors cannot capture defect features consistently.
The first question in vision inspection should therefore not be “Which AI model should we use?” but “What information distinguishes a defect from a good product?” The required data and optical configuration differ depending on whether the distinguishing feature is a color difference, a subtle surface variation, an actual height deviation, or a temperature distribution.
2D, 2.5D, and 3D Are Different Measurement Tools, Not Competing Technologies
| Data method | Primary information | Strengths | Limitations and considerations | Representative applications |
|---|---|---|---|---|
| 2D | X–Y pixels, color, brightness, and patterns | Fast acquisition, broad equipment options, and a relatively simple configuration | Difficult to distinguish reflection or shadow from actual height | Presence, text, color, position, and appearance |
| 2.5D | Surface-normal, reflectance, and phase channels emphasized by lighting variation | Visualizes fine scratches, relief, and contamination | Feature-emphasis imagery rather than an absolute height measurement | Defects on metal, painted, transparent, and high-gloss surfaces |
| 3D | X–Y–Z coordinates, Height Map, and Point Cloud | Quantitative measurement of height, flatness, volume, and geometry | Model selection must reflect FOV, working distance, and surface reflectance | Pin height, step height, assembly, weld geometry, and robot guidance |
| Thermal imaging and sensors | Temperature, vibration, pressure, current, gas, and related signals | Measures process conditions that are not visible in standard images | Sensor response time, calibration, and installation position must be managed | Equipment anomalies, high- temperature processes, and process prediction |
A single method may be selected, or several may be combined, depending on the inspection objective. For example, a battery top weld can be checked for contamination and color using 2D images while weld height and geometry are measured with 3D data. On highly reflective painted surfaces, reflections and defects are easily mixed in conventional 2D images, so 2.5D channels that emphasize surface slope and fine relief can be more effective.
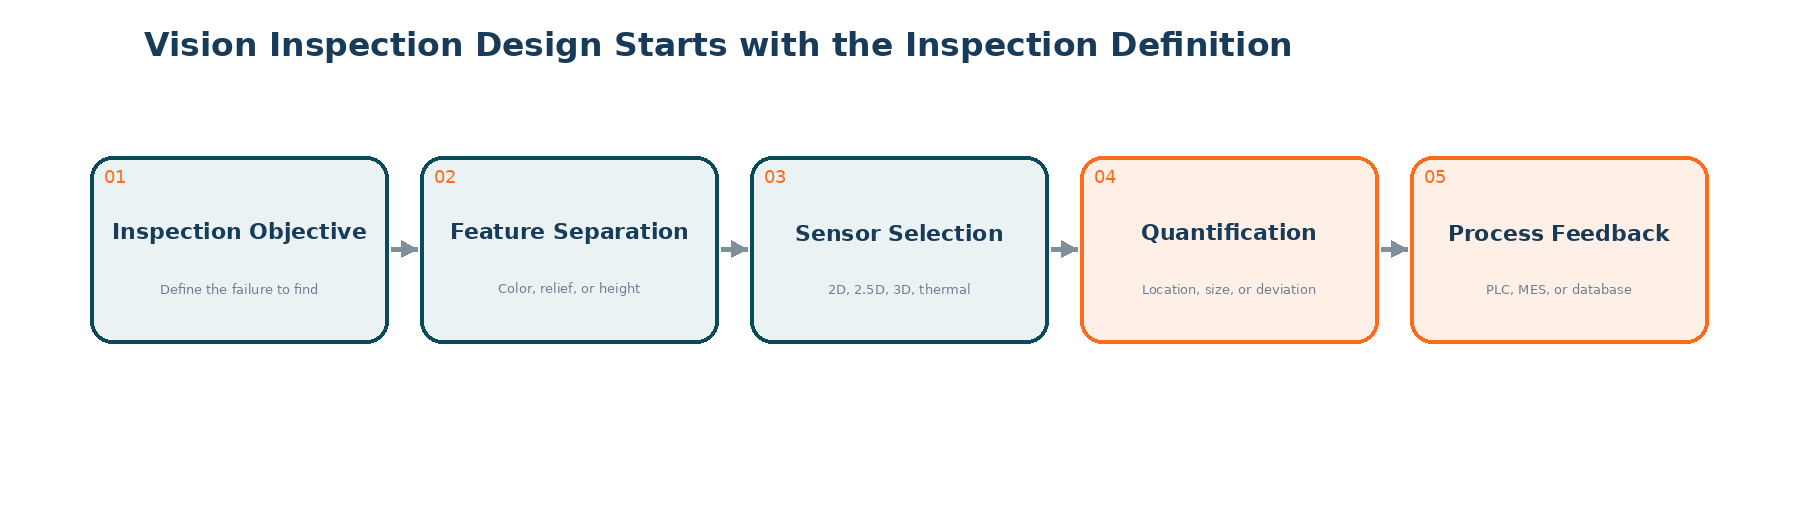
Figure 1. Vision-inspection design sequence from inspection objective to process feedback Source: Reconstructed by ITIV AI
2.5D Separates Surface Features Hidden in Conventional Images
A Hybrid Data Camera uses Photometric Stereo and Phase Measuring Deflectometry to output both original images and multiple processed channels. According to the supplied material, four imaging modes can selectively provide more than 40 original and processed images.1
Photometric Stereo uses multi-angle, multispectral illumination to calculate surface-normal vectors and reflectance information. The Kd channel highlights reflectance differences; Nx and Ny channels reveal directional defects; and NormMix and MinMax-family channels suppress reflections and shadows while emphasizing fine defects. Phase-based deflectometry visualizes scratches, dents, and curvature on highly reflective or transparent surfaces by analyzing deformation in projected fringe patterns.
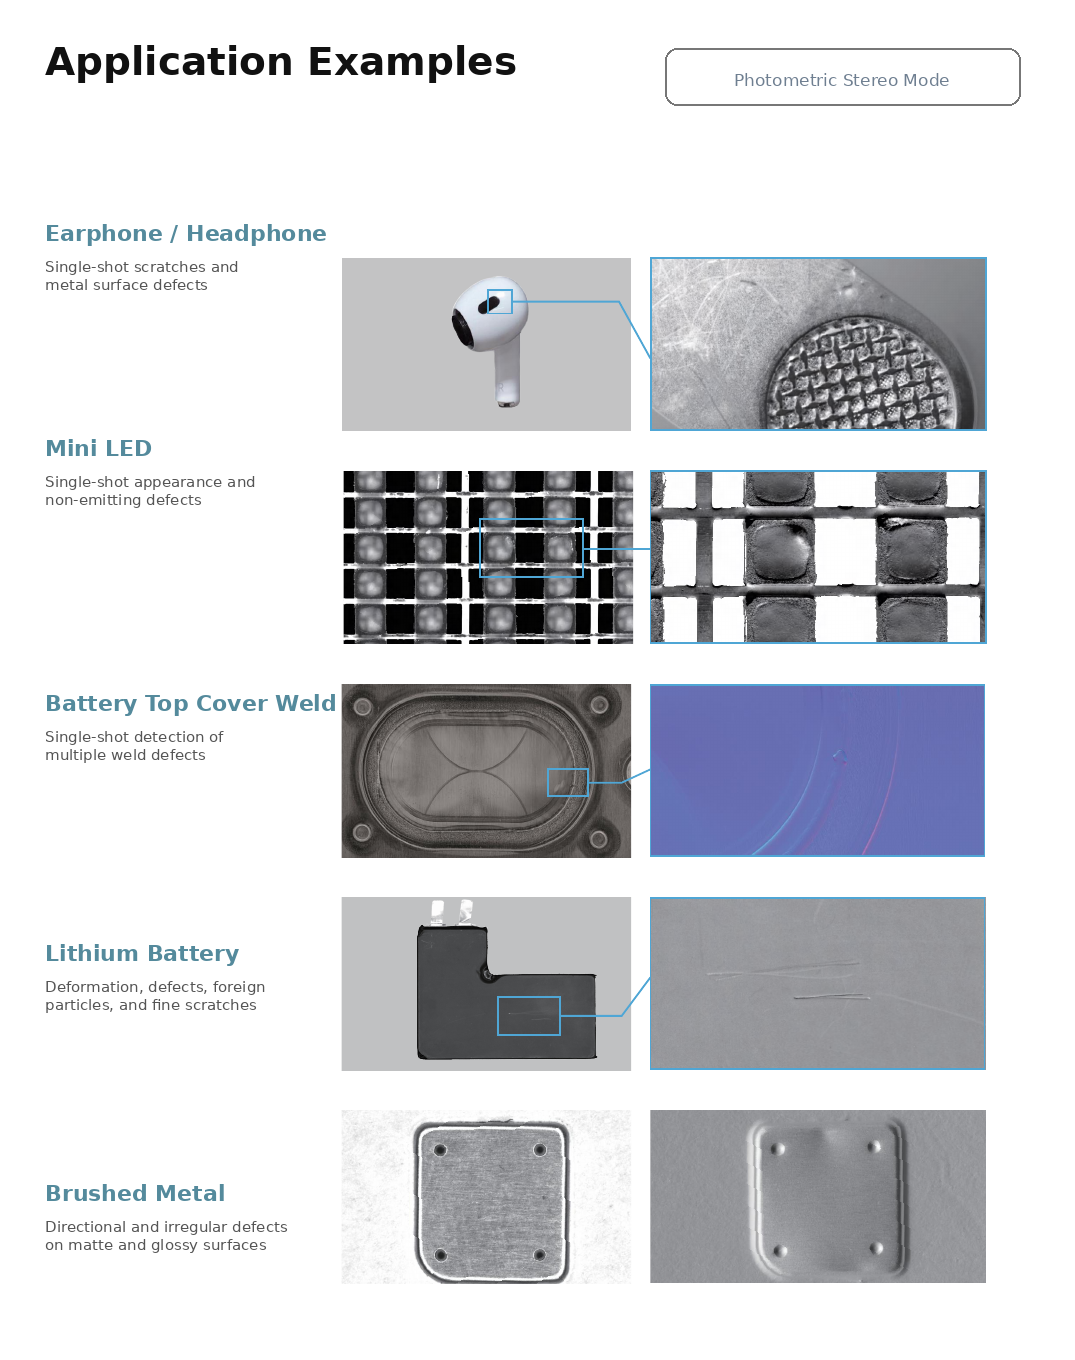
Figure 2. Surface-defect applications using 2.5D computational imaging Source: MegaPhase, Hybrid Data Camera product brochure
More channels are not automatically better. Effective channels should be selected according to the material and defect direction, while lighting intensity, exposure, and product-position variation must be stabilized in mass-production conditions. For AI training, it is often efficient to select one or several channels that separate the defect most clearly, or to use the original image together with selected feature channels.
3D Converts Height and Shape from Pixels into Measurements
A 3D camera adds Z-axis information to each pixel to create a Height Map and Point Cloud. Instead of judging whether a surface appears bright or dark, it can measure actual height, steps, flatness, volume, angle, and geometric deviation. Structured-light systems project a pattern and reconstruct three-dimensional coordinates by analyzing how that pattern is deformed in the camera image.
MegaPhase Sizector 3D materials list a maximum frame rate of 20.3 FPS, resolution up to 16.2 megapixels, area repeatability of approximately 0.03–0.05 μm depending on the model, and standard FOV ranges from 40 to 800 mm.2 These are selection criteria that vary with model, FOV, working distance, binning, and surface characteristics—not a single performance value guaranteed under every condition.
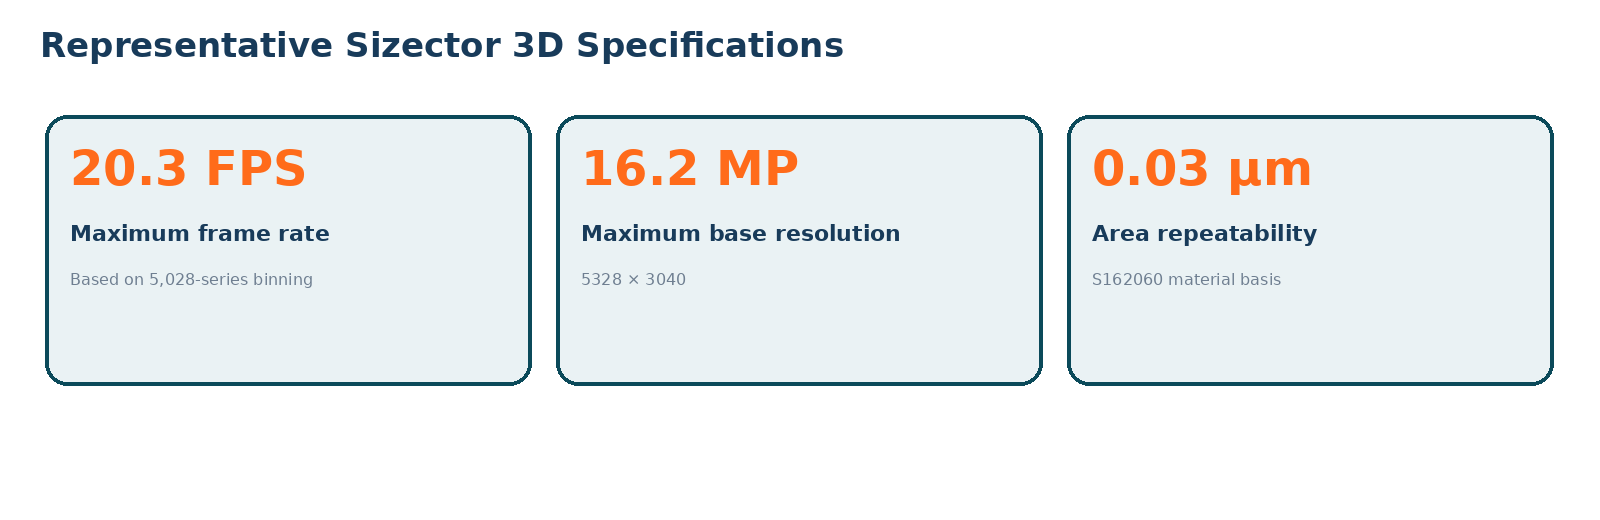
Figure 3. Representative performance indicators for the Sizector 3D product family Source: MegaPhase product materials; specifications vary by model and configuration
Resolution Should Be Calculated in Object-Space mm/px, Not Megapixels Alone
Even with a high-resolution camera, a wider field of view reduces the number of pixels occupied by a small defect. For example, imaging a 120 mm width with a 2,856-pixel horizontal camera produces a theoretical object-space resolution of approximately 0.042 mm/px. A 0.2 mm defect would occupy about 4.8 pixels. Actual detectability also depends on lens resolving power, focus, lighting, SNR, defect contrast, and the AI model, so this figure should be used only as an initial design calculation.
| Design item | Calculation or verification method | Shop-floor impact |
|---|---|---|
| Object-space resolution | FOV (mm) ÷ image pixel count | Determines the minimum number of pixels occupied by a defect |
| Cycle Time | Exposure + acquisition + processing + transmission + AI inference + PLC response | Determines whether judgment can be completed within line Tact Time |
| Repeatability | Evaluate variance and standard deviation from repeated measurements of the same target | Determines measurement stability and control limits |
| Gauge R&R | Separate variation from equipment, operator, and repeated measurement | Confirm that inspection-system variation is sufficiently smaller than process variation |
| Data completeness | Ratio of unmeasured areas, shadows, reflections, and missing data | Affects false calls, misses, and 3D reconstruction stability |
What Changes When 2D and 3D Are Used in a Single Inspection?
The battery-inspection brochure presents configurations that combine 2D appearance data and 3D geometric data for safety vents, sealing pins, cell terminals, cap plates, modules, and PACK inspection. In sealing-pin inspection, appearance defects such as missing welds, insufficient welds, burst points, slag, and arc pits can be identified while height and geometry are measured. Pixel-level image alignment allows color and height information at the same location to be compared together.3
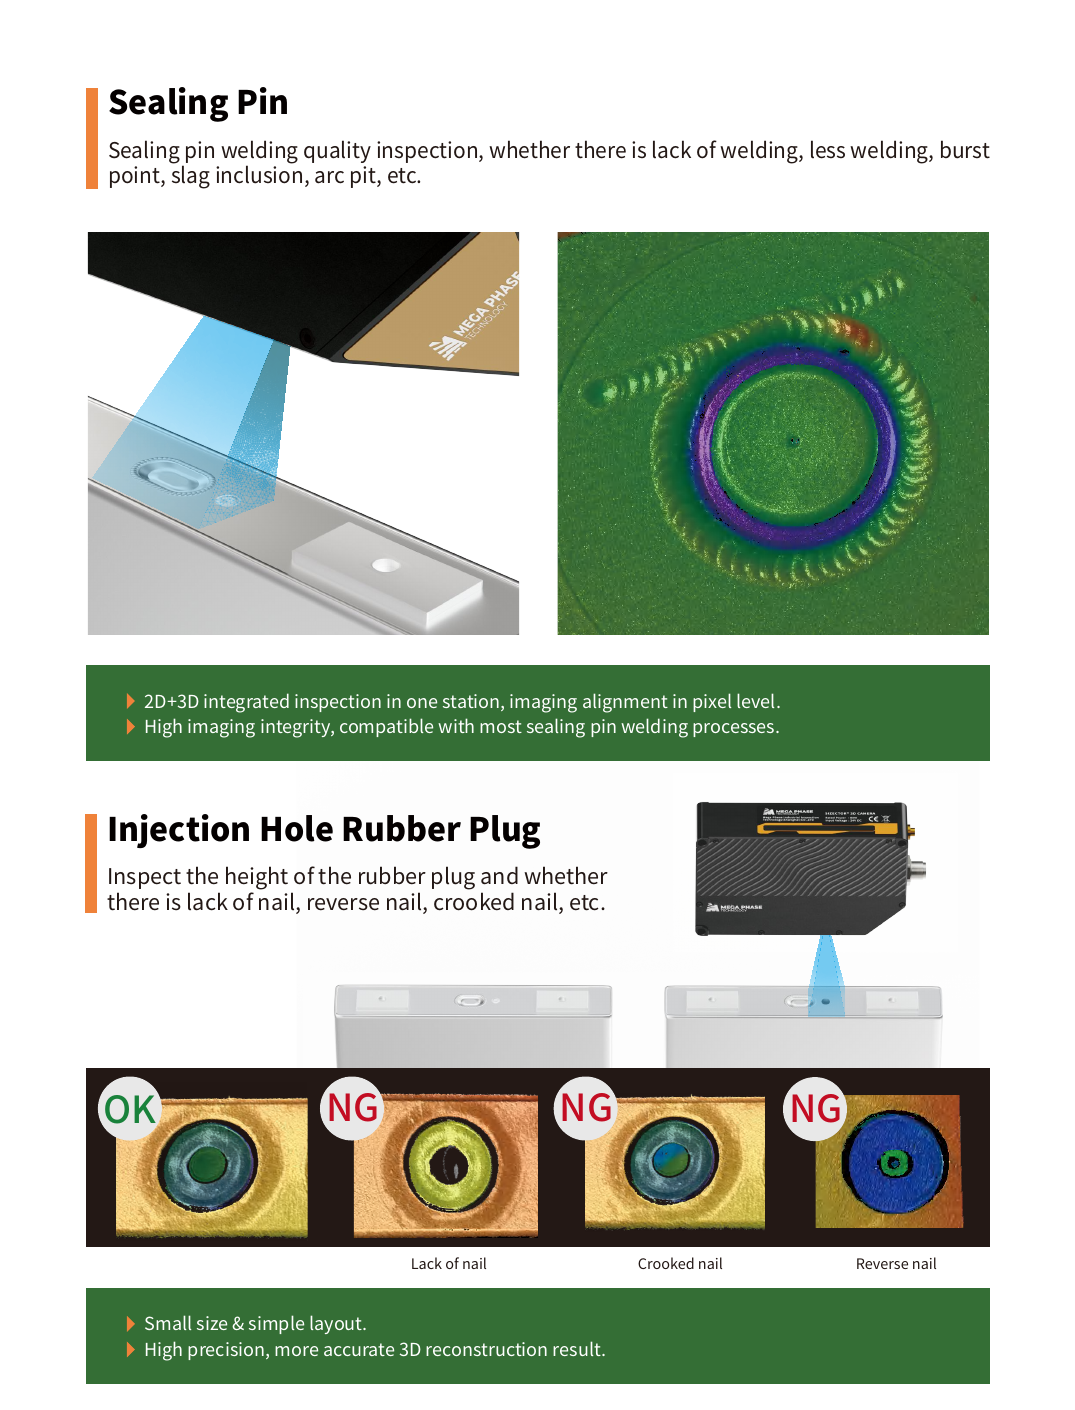
Figure 4. Example of 2D + 3D inspection for a battery sealing pin and rubber plug Source: MegaPhase, Automotive Battery Application Brochure
Multimodal inspection is different from simply adding more cameras. When aligned data channels are acquired from the same trigger, defect location and measurements can be combined into one inspection result. Not every inspection requires a multimodal configuration, however. If only color or presence must be checked, 2D may be more economical. If absolute height is not required, 2.5D may be faster and simpler.
AI Vision Should Produce More Than an OK/NG Result
- Defect location / Store X–Y or 3D coordinates in the product coordinate system for reinspection and equipment correction.
- Defect size and geometry / Generate values directly linked to quality criteria, including area, length, width, height, volume, and flatness.
- Confidence and source history / Store the AI score, deployed model version, original and processed images, and process conditions together.
- Product and process traceability / Connect inspection results with barcode, lot, equipment, and work-time data in MES and database systems.
- Process feedback / Link defect patterns to equipment variables and use them as inputs for alarms, guidance, and parameter changes.
ITIV CAM quantifies image and sensor data and combines AI detection, classification, segmentation, and rule-based judgment to generate OK/NG results, defect type, location, deviation, and inspection history. Here, an image is not merely a picture displayed on a screen; it becomes data that the next process can use.
Five Items That Must Be Validated Before Shop-Floor Deployment
| Validation item | Key question | Recommended validation method |
|---|---|---|
| Detectability | Can good and defective products be separated in images or measured values? | Capture actual good and defective samples and compare contrast by channel |
| Speed | Does the full decision cycle finish within Tact Time? | Measure Cycle Time under worst-case exposure, transmission, and inference conditions |
| Reproducibility | Does performance remain stable across shifts, time, temperature, and position changes? | Repeated measurement, long-duration run, and Gauge R&R |
| Integration | Are decision values delivered to PLC, MES, and database systems in the required format? | Pretest I/O, communication protocols, and ID mapping |
| Maintenance | Are model, parameter, and lighting changes recorded and controlled? | Version control, reference samples, and periodic validation procedures |
Key Conclusion
The factory’s eyes are not the camera alone, but the entire measurement system. Vision becomes an input to autonomous manufacturing only when the appropriate 2D, 2.5D, 3D, or sensor method is selected for the inspection objective and stable optics, quantitative data, and process integration are designed together.
In Closing

References and Sources
※ External figures and cases in this article were compiled from official publications by institutions and companies and from the supplied product brochures. ITIV AI visually reconstructed the charts and diagrams from the original figures or technical structures.
Bibliography
- NIST, “2026 Roadmap on Artificial Intelligence and Machine Learning for Smart Manufacturing”. Reference: advanced sensing and perception, industrial big data, and the direction of manufacturing AI toward autonomous systems. Link
- ITIV AI, “AI Solutions Overview.” Reference: acquisition and quantification of image, sensor, and process data, combined with AI analysis and shop-floor execution. Link
※ The 0.042 mm/px calculation assumes a 120 mm FOV and 2,856 horizontal pixels as a design example. It does not guarantee actual detection performance.
Footnotes
-
MegaPhase, “Hybrid Data Camera Product Brochure.” Reference: Photometric Stereo and PMD methods, more than 40 multi-image channels, resolution and frame-rate specifications, and surface-defect applications. Link ↩
-
MegaPhase, “Sizector 3D Industrial Camera Product Brochure.” Reference: maximum 20.3 FPS, 16.2 MP, model-specific repeatability, and FOV specifications. Link ↩
-
MegaPhase, “Automotive Battery Application Brochure”. Reference: 2D + 3D appearance and geometry inspection for battery cells, modules, and PACKs. Link ↩